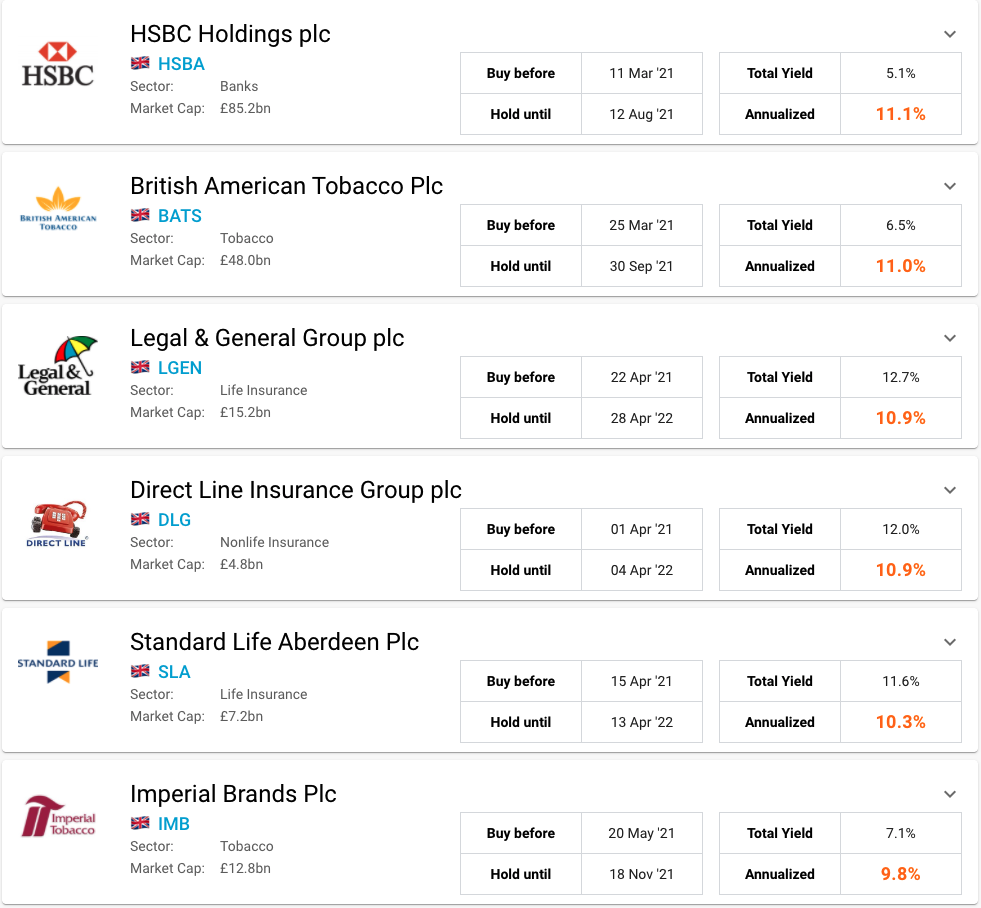
The Optimizer identifies high-yield buying opportunities over different time periods. It highlights shares that are promising a good yield (based on our dividend forecasts) over the short to medium term.
Note that the Optimizer does not represent a recommendation to invest or not invest. It is intended only to provide information to investors who in all cases should further research the company before making an investment decision.
Clicking the blue ticker link below the company name will take you to the company detail page.
Yield Calculation
Yield is a calculation of the dividend payments over the latest share price. Large dividend payments and a low share price means a high yield.
Companies are ordered by their "annualized yield". This is calculated by adding together their upcoming dividends, dividing this by the current share price and then dividing or multiplying this out to an annual basis.
Due to the way many UK companies split their annual dividends into an interim and final payment, with the final often consisting about ⅔ of the total, we can use the Optimizer to find some very good yields. This works especially well when a company is about to pay a final dividend, followed by an interim in 6 months, and another final dividend 6 months after that
We annualize the yield rather than taking the total yield since some companies may pay quarterly (4 dividends per year) and some may pay annually (one per year). By annualizing the yield you get a fair comparison.
The Optimizer allows you to choose an investment time horizon of the next 2, 3 or 4 dividends. The filter defaults to 3 dividends because typically in the UK companies pay 1 interim and 1 final in a year.
So if a company is about to pay its final dividend, you can receive 2 finals plus an interim dividend in slightly more than 1 year. This represents a better yield than just taking the interim and final. But in order to compare these yields we need to then convert to an annual timeframe, hence the annualized yield.
For example assume a company has the follow dividends forecast:
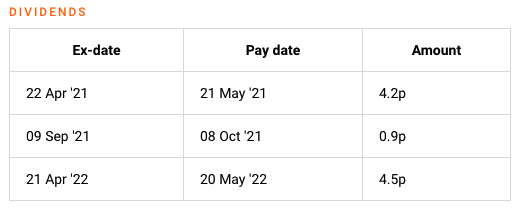
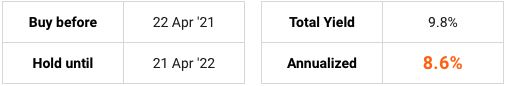
At the time of writing (February 2021) the company is forecast to pay 9.6p in dividends over the next 14 months. The share price is currently 98p, so that represents a total yield of 9.8%, which on an annual basis (i.e. multiplied by 12/14) is 8.6%.
The Optimizer provides a summary of this calculation giving details of when the share needs to be purchased by and held until (the ex date of the first and last dividend):
The current share price and the sum of the dividends is included to illustrate the calculation:
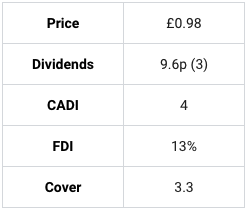
The other 3 fields (CADI, FDI and Cover) are included to help assess the safety of our forecasts and the suitability of the security as an investment.
CADI is the Consecutive Annual Dividend Increases, i.e. the number of years this company has been increases it's dividend lately
FDI is the Forecast Dividend Increase - this is the percentage increase (or decrease) we're expecting the dividend payment to be in the coming year.
Cover is the number of times the dividend is covered by earnings. A cover of 1 means the company has earned enough to pay the dividend.
In all cases higher is better.
Filters
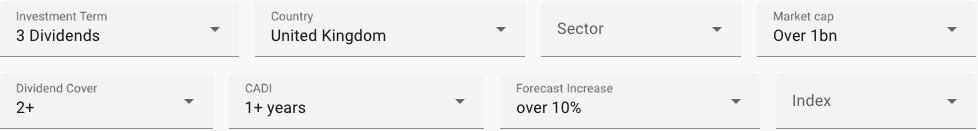
You can select companies which match your investment criteria using the filters.
Select from UK, US or European companies using the country filter.
Adjust the investment horizon by using the Investment Term (6, 12, 18 or 24 months; or the next 2, 3 or 4 dividends).
Filter larger or smaller companies using the Market cap filter, and potential dividend risk using the Cover, CADI and Forecast Increase.
You can also select from certain sectors and indices using these filters.
Summary
The Optimizer is a powerful tool for assessing the best yielding companies based on forecast (not historical) dividends and the timing of the purchase and sale, rather than a simple annual total.
Check out Optimizer here.